This term, our geography learning has taken us on an exciting journey into the world of maps and mountains. We have been studying contour lines and learning how they are used to show elevation and height on maps.
To begin with, we explored contour maps of familiar local places, including Patterdale Hall and Levens village. Looking at areas we know well helped us to understand how contour lines work in real life. We noticed that:
- Closely spaced contour lines show steep slopes, such as hillsides or valleys
- Widely spaced contour lines show flat or gently sloping land
By comparing the maps with what we know of these locations, we were able to see how hills, valleys and flatter areas are represented on Ordnance Survey maps.
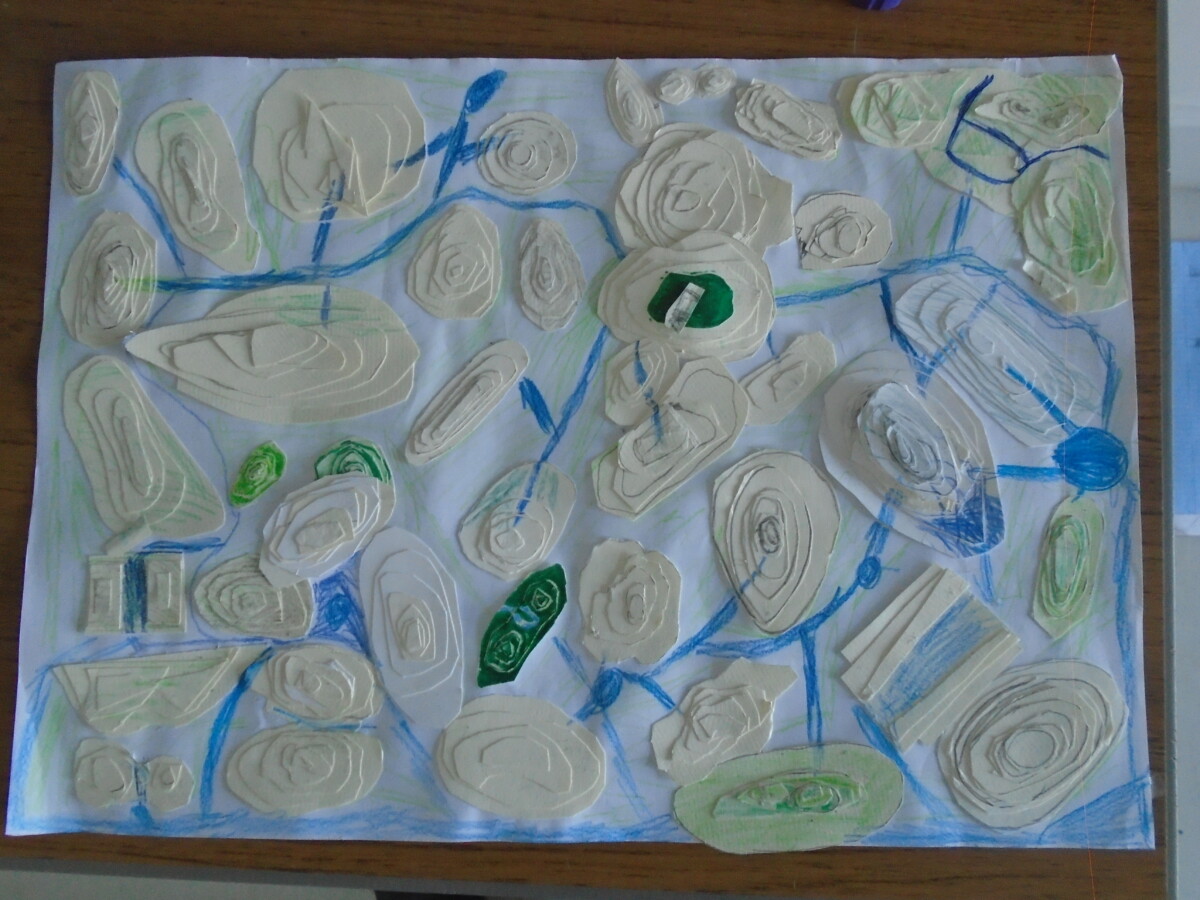
To bring our learning to life, we then designed and built our own mountains using thick card. Each layer of card represented a different contour line, stacked carefully to show increasing height. This helped us visualise how a flat map can represent a three‑dimensional landscape.
Each mountain was unique. Some had:
- Steep cliffs and sharp peaks
- Wide, flat plateaus
- Gentle slopes and rounded summits
- Valleys and passes between high points
- In one case, a dramatic overhanging cave opening!
Once our individual mountains were complete, we combined them into one large imaginary mountain range, creating an exciting landscape with a variety of elevation features. Some students also noticed that this is how features like rivers and lakes are formed in nature, so we added some of those too.